


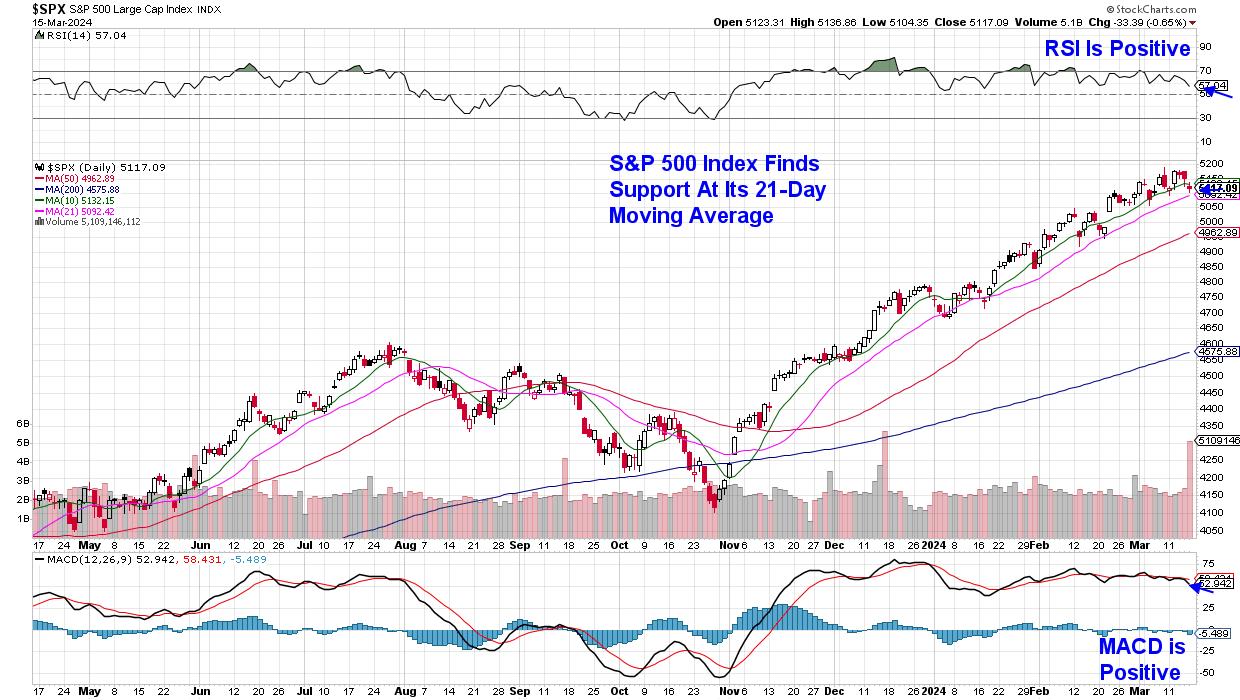
The S&P 500 ended the week with a slight pullback that has this Index closing below its key 10-day simple moving average, but above its 21-day moving average. With the RSI and MACD in positive territory, the near-term uptrend in this Index remains in place. While last week’s orderly price action is in line with four other nominal pullbacks we’ve seen so far this year, there’s been plenty of turbulent price action beneath the surface, as investors have responded sharply to several high-profile companies after the release of their earnings reports.
 Daily Chart of S&P 500 Index
For many who follow my work, you’ll know that I’m quite bullish on gaps up in price after earnings, as they often lead to further upside after a period of consolidation to digest the large gain. A prime example would be Shake Shack (SHAK), which gapped up in price after the release of strong earnings in mid-February, which pushed the stock out of a base and into an uptrend. SHAK was a part of my MEM Suggested Holdings List just prior to the release, and it remains on our buy list as it’s in an uptrend.
Today, we’re going to focus on stocks that gap down after earnings but then go on to reverse that gap down. These stocks will generally have more work to do before entering a new uptrend; however, shorter-term investors can take advantage of any reversal if using the proper intraday chart to guide your entry.
Let’s take a look at Switzerland-based footwear company On Holding (ONON). The stock gapped down 18% on Tuesday after reporting earnings that were below estimates. As you can see on the daily chart below, investors came in on the dip so that it closed the day down 8%. The stock has continued to trade higher, and ONON is now in an uptrend.
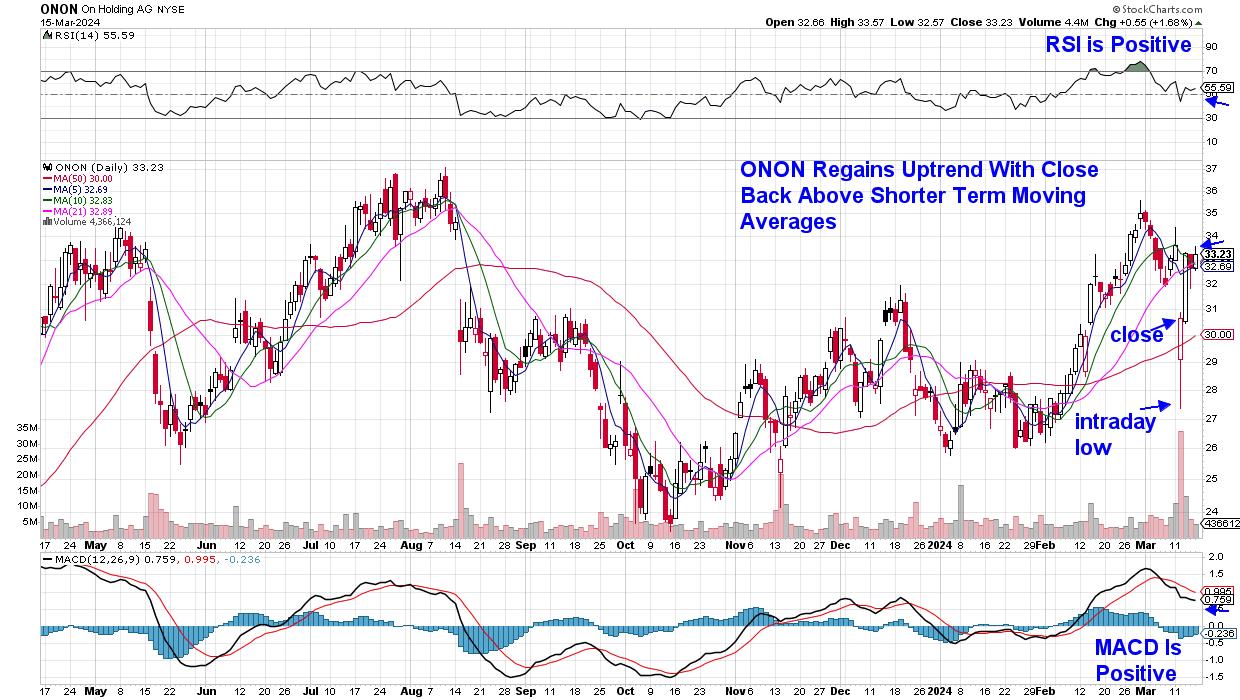 Daily Chart of On Holding (ONON)
As investors begin to buy the stock on the dip, shorter-term investors will want to keep a close eye on a 15 minute/intraday chart. Using the same indicators as on a daily chart, the first positive signal would be a close above the 5 and 13 simple moving averages. From here, you’ll be on the lookout for confirmation of an uptrend by way of the RSI moving above 50 and into positive territory. For ONON, this took place in the $30 range. In order to stay with the trade, both signals would need to remain in place which, in this case, would have netted 10%.
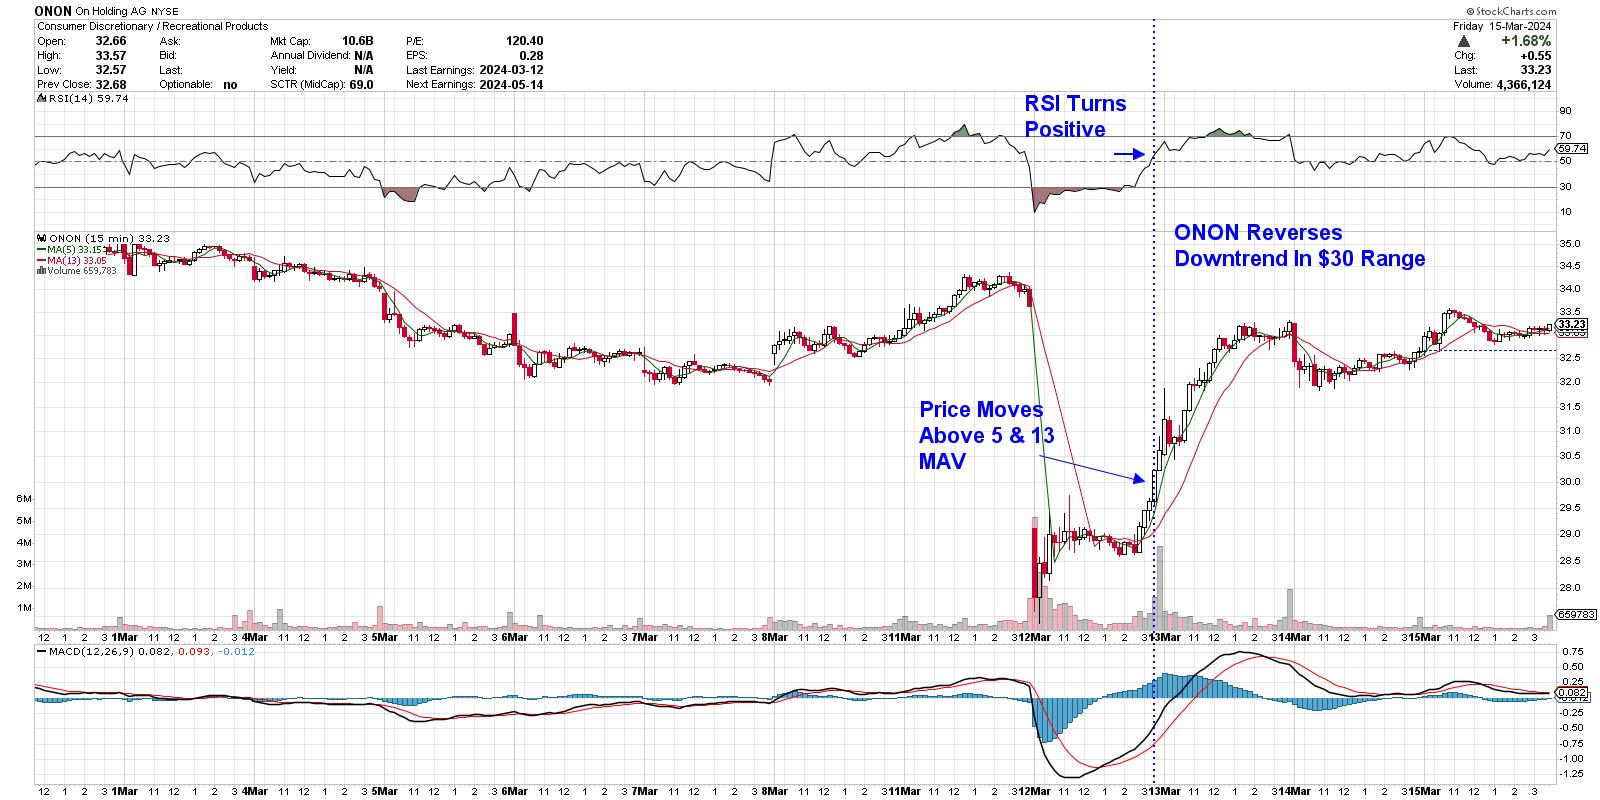 Intraday/15-Minute Chart of On Holding (ONON)
As noted earlier, the broader markets are in an uptrend and, while constructive, the Technology sector is close to turning negative after several heavyweight areas came under selling pressure last week. For those who’d like insight into what’s taking place within this leadership area of the markets, use this link here to take a four week trial of my twice-weekly MEM Edge report at a nominal fee. You’ll also receive information relating to rotation taking place elsewhere in the markets, as well as alerts to a reversal of the current market uptrend.
Warmly,
Mary Ellen McGonagle