


The Economic Report of the President (ERP), released annually by the Council of Economic Advisers, is always full of useful and interesting data, and the just‐published 2024 edition is certainly no exception. The new ERP’s international trade chapter is particularly noteworthy, given the increasing hostility to open trade and investment in Washington and the often‐erroneous protectionist narratives used to support it. In a welcome development, the ERP thoroughly punctures several of these narratives by summarizing what the actual economics literature says about international trade and investment in the United States today, mostly in line with (and in one case even citing) the essays we’ve published over the last year as part of Cato’s ongoing Defending Globalization project.
Below are ERP excerpts supporting six important trade and investment facts, with sources in parentheses and bolded emphasis mine.
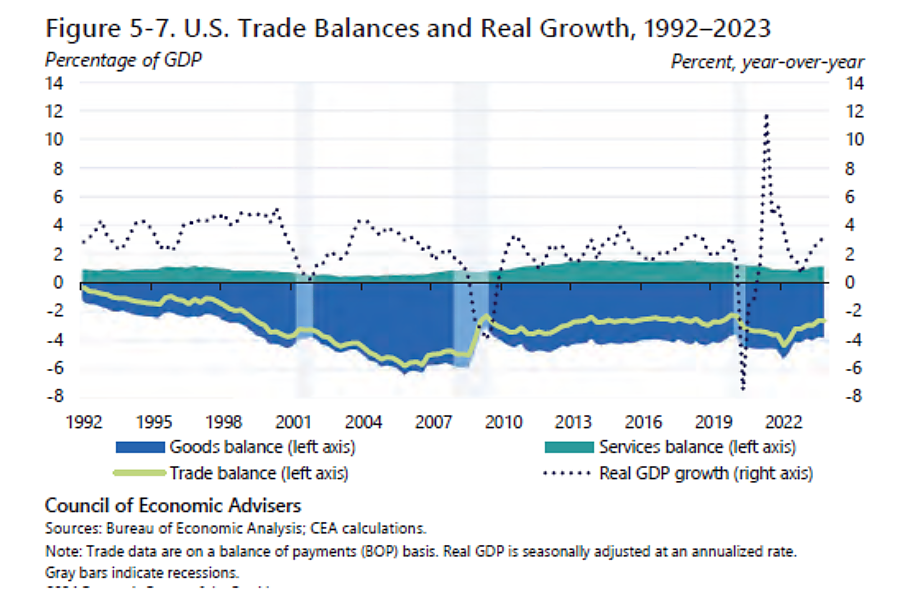
Fact 1: Tariffs and trade agreements don’t drive the US trade deficit.
U.S. Trade Deficits Are Driven by Aggregate Saving and Investment Patterns
Trade deficits can elicit negative attention if the presumption is that the GDP accounting identity (where negative net exports—exports minus imports—are subtracted from GDP) describes the totality of the relationship between trade and growth. Trade deficits are also sometimes associated with import competition, which has historically generated concentrated employment losses for certain groups of workers. However, the connections between trade deficits, economic growth, and employment are closely tied to broader macroeconomic conditions. For example, when an economy is operating at full employment, a rising trade deficit can be a pressure‐release valve, providing needed supplies of imported goods and services that help prevent overheating (Baker 2014). Moreover, imports complement domestic spending on American goods and services, so that their negative accounting impact on GDP is partially offset by the domestic value added generated, along with downward pressure on inflation. Trade, including via higher imports, can also boost the productivity of importing firms and the broader economy by supporting higher growth (CEA 2015a). Data support this view; the U.S. trade deficit tends to be countercyclical and is largest during periods of strong GDP growth because the same drivers of increased domestic demand (including savings and investment rates) also tend to fuel increased import demand (CEA 2015b).…
Overall trade balances. The fundamental drivers of a country’s overall trade balance are its relative saving and investment rates—both public and private (Ghosh and Ramakrishnan 2024). Countries with lower domestic saving than domestic investment (likely as a result of low domestic saving rates, high domestic investment rates due to attractive economic opportunities, or a combination of the two) tend to run trade deficits and accompanying current account deficits (where the current account balance is defined as the trade balance plus net foreign investment income plus net transfer payments from foreign income sources like worker remittances and foreign aid). The trade balance typically accounts for the bulk of the current account balance and is highly correlated with it, so, for expositional simplicity, we focus on the trade balance. Trade deficits are necessarily matched by capital and financial account surpluses (the net inflows of foreign lending necessary to finance the trade deficit)—as is the case with the United States.
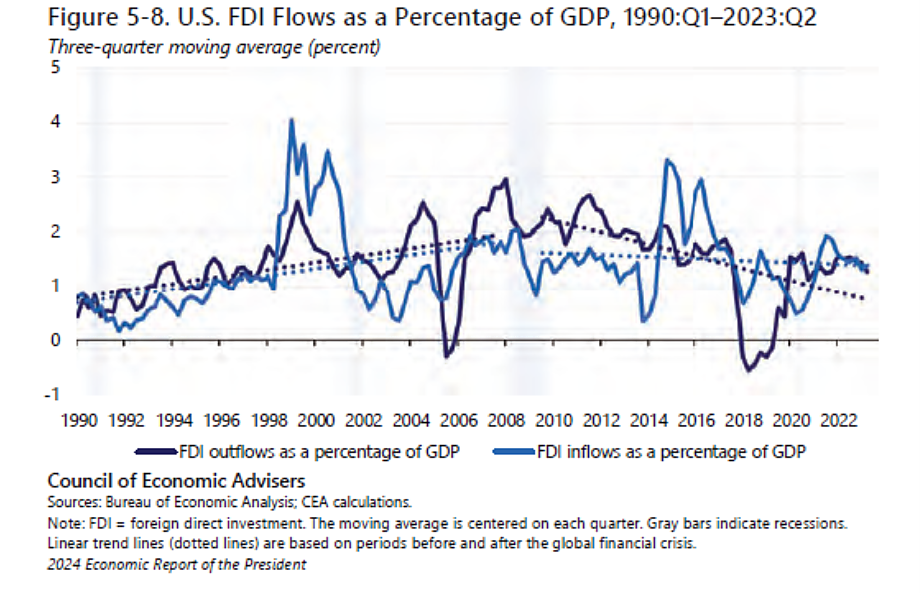
Fact 2: Foreign direct investment (FDI) is good; the United States is the world’s FDI leader; and there’s been no “giant sucking sound” of capital leaving the country.
The United States Leads in Global FDI Flows
The United States is the largest source of and destination for FDI flows globally. Over 20 percent of both U.S. FDI inflows and outflows in 2022 were targeted at cross‐border manufacturing investments (OECD 2023b; BEA 2023b). In addition to providing another source of financing for domestic investments, FDI tends to increase wages and productivity in target firms (Hale and Xu 2016) and can also generate positive spillovers across U.S. firms within an industry (Keller and Yeaple 2009). Reflecting long‐standing trends, the large majority of U.S. FDI flows are either destined for or originate from the country’s closest trading partners. For example, in 2022, Canada and countries in Europe accounted for 79 percent of inward U.S. FDI flows and 65 percent of outward U.S. FDI flows (BEA 2023c).
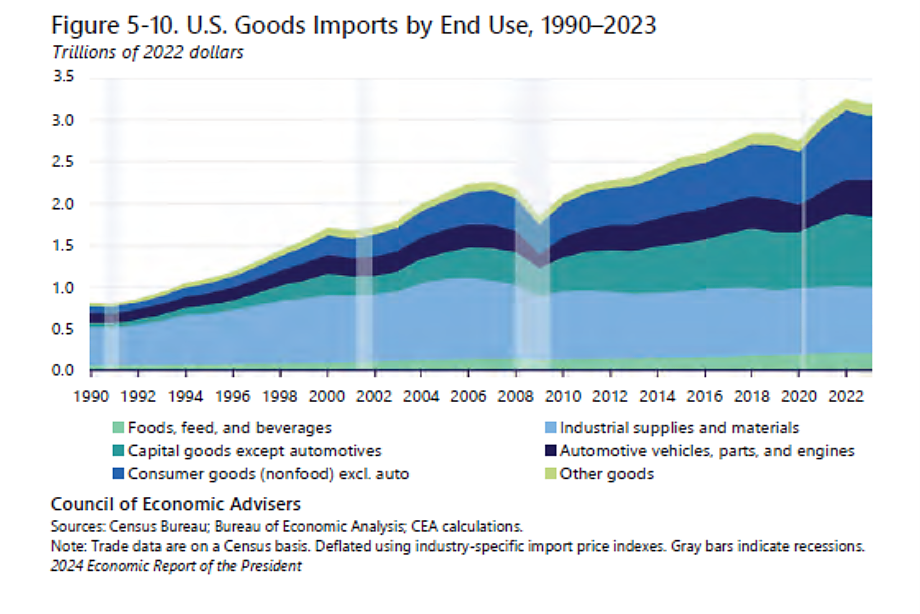
Fact 3: Imports (and exports) benefit U.S. manufacturers, especially multinationals.
Multinational firms—themselves fueled by the information and communications revolution—have been particularly adept at taking advantage of cross‐border input cost differentials. By establishing foreign affiliates through FDI, these firms can mediate trade with both foreign subsidiaries (within‐firm trade) and unaffiliated firms (arm’s‑length trade) within [global value chains] (OECD 2018). Multinational firms accounted for, respectively, 65 percent and 60 percent of U.S. goods exports and imports on average between 1997 and 2017 (Kamal, McCloskey, and Ouyang 2022). And within‐firm trade accounts for a large share of multinationals’ total trade flows: In 2022, one third (33.7 percent) of U.S. exports and almost half (46.6 percent) of U.S. imports by value were between multinational parent firms and their affiliates or related parties (U.S. Census Bureau 2022). The growth of trade within multinational firms (i.e., flows between parents and affiliates) underscores the highly fragmented nature of production.
Global supply chains’ prevalence in U.S. production can also be observed in the high share of intermediate goods or imported input trade in the United States (figure 5–10). Industrial supplies (e.g., lumber and steelmaking materials) and capital goods (e.g., drilling equipment)—typically, inputs into final goods—are highly positively correlated with [global value chain] trade and accounted on average for over half of imports between 1992 and 2022 (Hummels, Ishii, and Yi 2001; Baldwin and López‐González 2014). The import share of industrial materials grew more than that of any other product group between 1992 through the onset of the global financial crisis in 2008, showcasing how multinationals’ FDI and the establishment of GVC linkages can support greater trade flows.
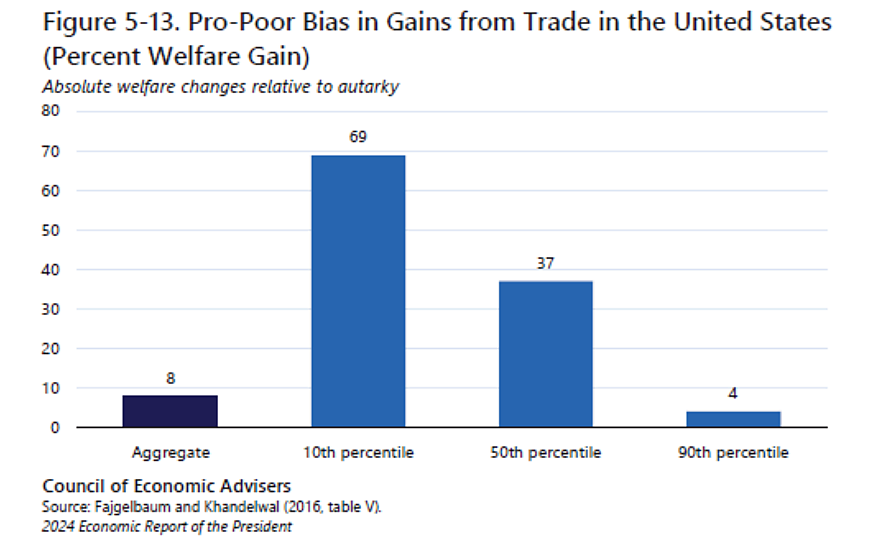
Fact 4: Imports (including ones from China) also benefit American consumers, especially poorer ones.
Import competition from China was also accompanied by a substantial fall in U.S. consumer prices, with disproportionate benefits accruing to low‐ and middle‐income households because they have higher shares of tradable goods like food and apparel in their consumption baskets (Fajgelbaum and Khandelwal 2016; Russ, Shambaugh, and Furman 2017). Causal estimates suggest that a 1‑percentage‐point increase in Chinese import penetration led to a decline in consumer price inflation of 1 to 2 percentage points—largely reflecting indirect pro‐competitive cost effects, where greater foreign competition induces domestic firms to lower markups and thus further drives down prices (Jaravel and Sager 2019). Considering the modeled impact of increased Chinese import penetration across U.S. geographic regions, Galle, Rodríguez‐Clare, and Yi (2023) find that almost 90 percent of the U.S. population saw an increase in purchasing power, with those regions that saw purchasing power losses being spatially correlated with regions that also saw a loss in manufacturing employment from the China shock.
The results, showing that trade with China has benefited most Americans’ purchasing power, are consistent with a larger body of evidence on the benefits from trade with all countries—again, with disproportionate benefits accruing to lower‐income households.35 For example, the average U.S. household has been shown to gain 8 percent in purchasing power from trade compared with a counterfactual autarky (Fajgelbaum and Khandelwal 2016).36 However, the lowest‐income U.S. households gain the most, at 69 percent (figure 5–13).
fn. 35: There is also a literature documenting welfare increases due to greater access to varieties of goods through trade (e.g., Broda and Weinstein 2006; Melitz and Trefler 2012).
Fact 5: China—and Permanent Normal Trade Relations, in particular—didn’t cause most U.S. manufacturing job‐losses, even during the “China Shock.”
Close to a fifth (16 percent) of the decline in manufacturing employment between 2000 and 2007 has been attributed to the rise in import competition from China (Caliendo, Dvorkin, and Parro 2019). Firms that reorganized activities away from the production of machinery, electronics, or transportation equipment and toward wholesale, professional services (including research and development), and management drove almost a third of the negative manufacturing employment decline between 1990 and 2015 (Bloom et al. 2019). Several factors have been analyzed to understand the surge in U.S. imports from China during this period, including the United States granting China permanent normal trade relations in 2000, China’s accession to the World Trade Organization in 2001, reduced trade and investment policy uncertainty associated with these policy actions, and China’s own trade and domestic reforms (e.g., tariff reductions and privatizations) (Lincicome and Anand 2023).
(For those interested, my Cato essay cited in the ERP excerpt above finds that, based on various economic studies, China’s own market‐based reforms likely drove around two‐thirds of the “China Shock,” with U.S. trade liberalization accounting for the rest.)
Fact 6: Today, U.S. companies engaged in trade are huge job creators.
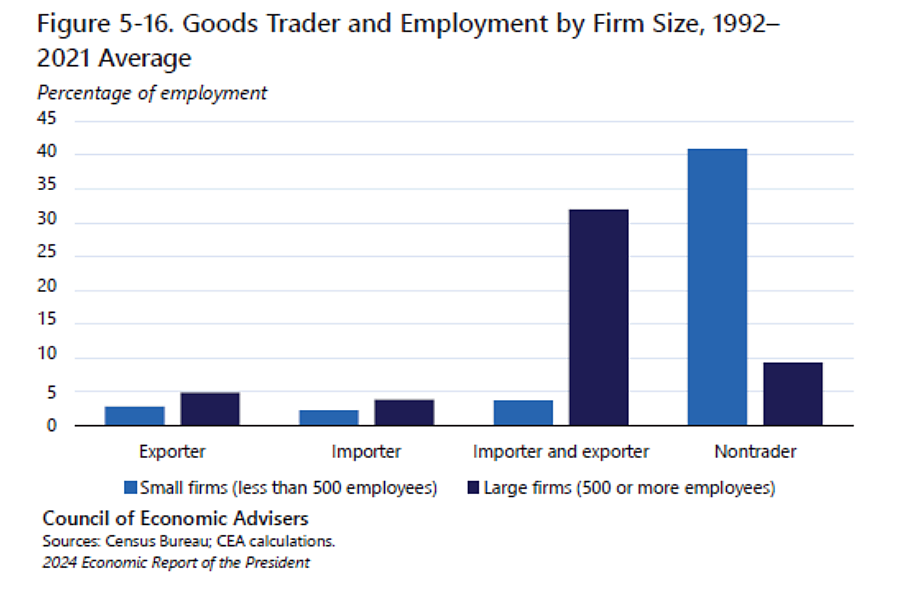
[Global value chains] have created strong interconnections between exporting and importing—which are often performed by the same firms. Among goods traders, averaged over the period 1992–2021, firms that both export and import goods account for a plurality of total U.S. private sector employment (36 percent), followed by firms that only export goods (8 percent) and firms that only import goods (6 percent) (figure 5–16). The majority of employment at goods traders is by large firms (defined as those employing 500 or more workers); in contrast, the majority of employment at nontraders is by small firms (those employing fewer than 500 workers). Nevertheless, small firms directly engaged in the goods trade account for almost 10 percent of national employment.…
Goods traders’ contribution to net job creation has grown over recent years: During the 2001–7 period, goods traders accounted for only 10 percent of total net job creation; but between 2008 and 2019, that figure rose to 60 percent. Overall, goods traders were responsible for almost 40 percent of net job creation in the U.S. economy between 1992 and 2019 (Handley, Kamal, and Ouyang 2021).38 These statistics underscore the changing nature of the U.S. production landscape, where both exports and imports support domestic jobs.
fn. 38: Handley, Kamal, and Ouyang (2021) document that vast majority of goods‐traders’ contribution to net job creation is driven by the opening of new establishments, particularly, in services‐providing sectors like wholesale, retail, business and professional services. These patterns hint at the complementarity between manufacturing and services activities as well as the sectoral diversity in job creation tied to trade participation.
In Washington today, the unfortunate consensus among many politicians and pundits is that trade and globalization have been an unmitigated disaster for America and the working class, regardless of the actual facts. It’s good to see that White House economists aren’t buying into this new consensus, though it’d of course be even better if their views were more reflected in U.S. policy too.
For more trade and globalization facts, check out the Defending Globalization essays here.