


Today’s stock market action uncovered some unusual activity. While the broader stock market indexes rose—the S&P 500 hit a record close, and the Dow Jones Industrial Average snapped a three-day losing streak—it was interesting that Communication Services and Technology were the worst-performing S&P 500 sectors.
The Sector Summary below shows that all 11 S&P 500 sectors were green at the close on Wednesday. However, Utilities, Real Estate, and Industrials were the top three leading sectors. One day doesn’t make a trend; however, if it continues, it would indicate that investors are getting more comfortable with the overall market and are not afraid to diversify their investments among different asset types.
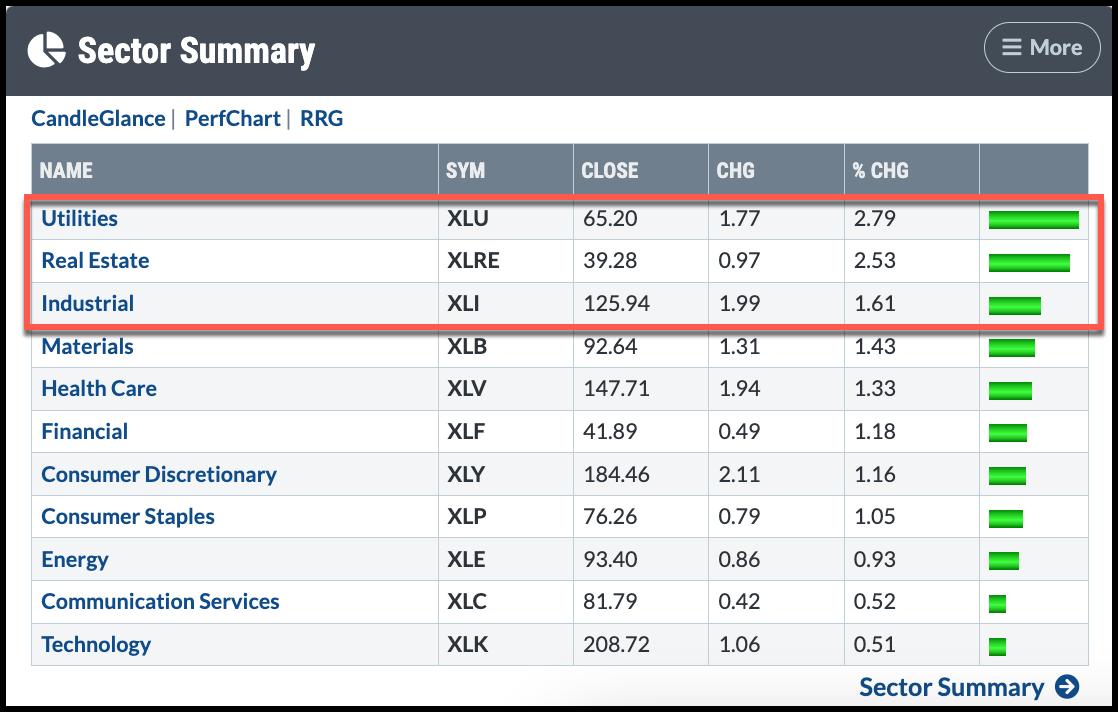
CHART 1. SECTOR SUMMARY FOR WEDNESDAY, MARCH 27. All S&P 500 sectors are positive, but Communications Services and Technology fell to the bottom.Chart source: StockCharts.com. For educational purposes.
A Broad Rally
If you run the New All-Time Highs scan, one of the scans in the StockCharts Sample Scan Library, there were over 40 stocks and exchange-traded funds representing different sectors and market caps. The S&P 500 Equal-Weighted Index ($SPXEW) closed higher (see chart below), confirming that Wednesday’s rally was broad.
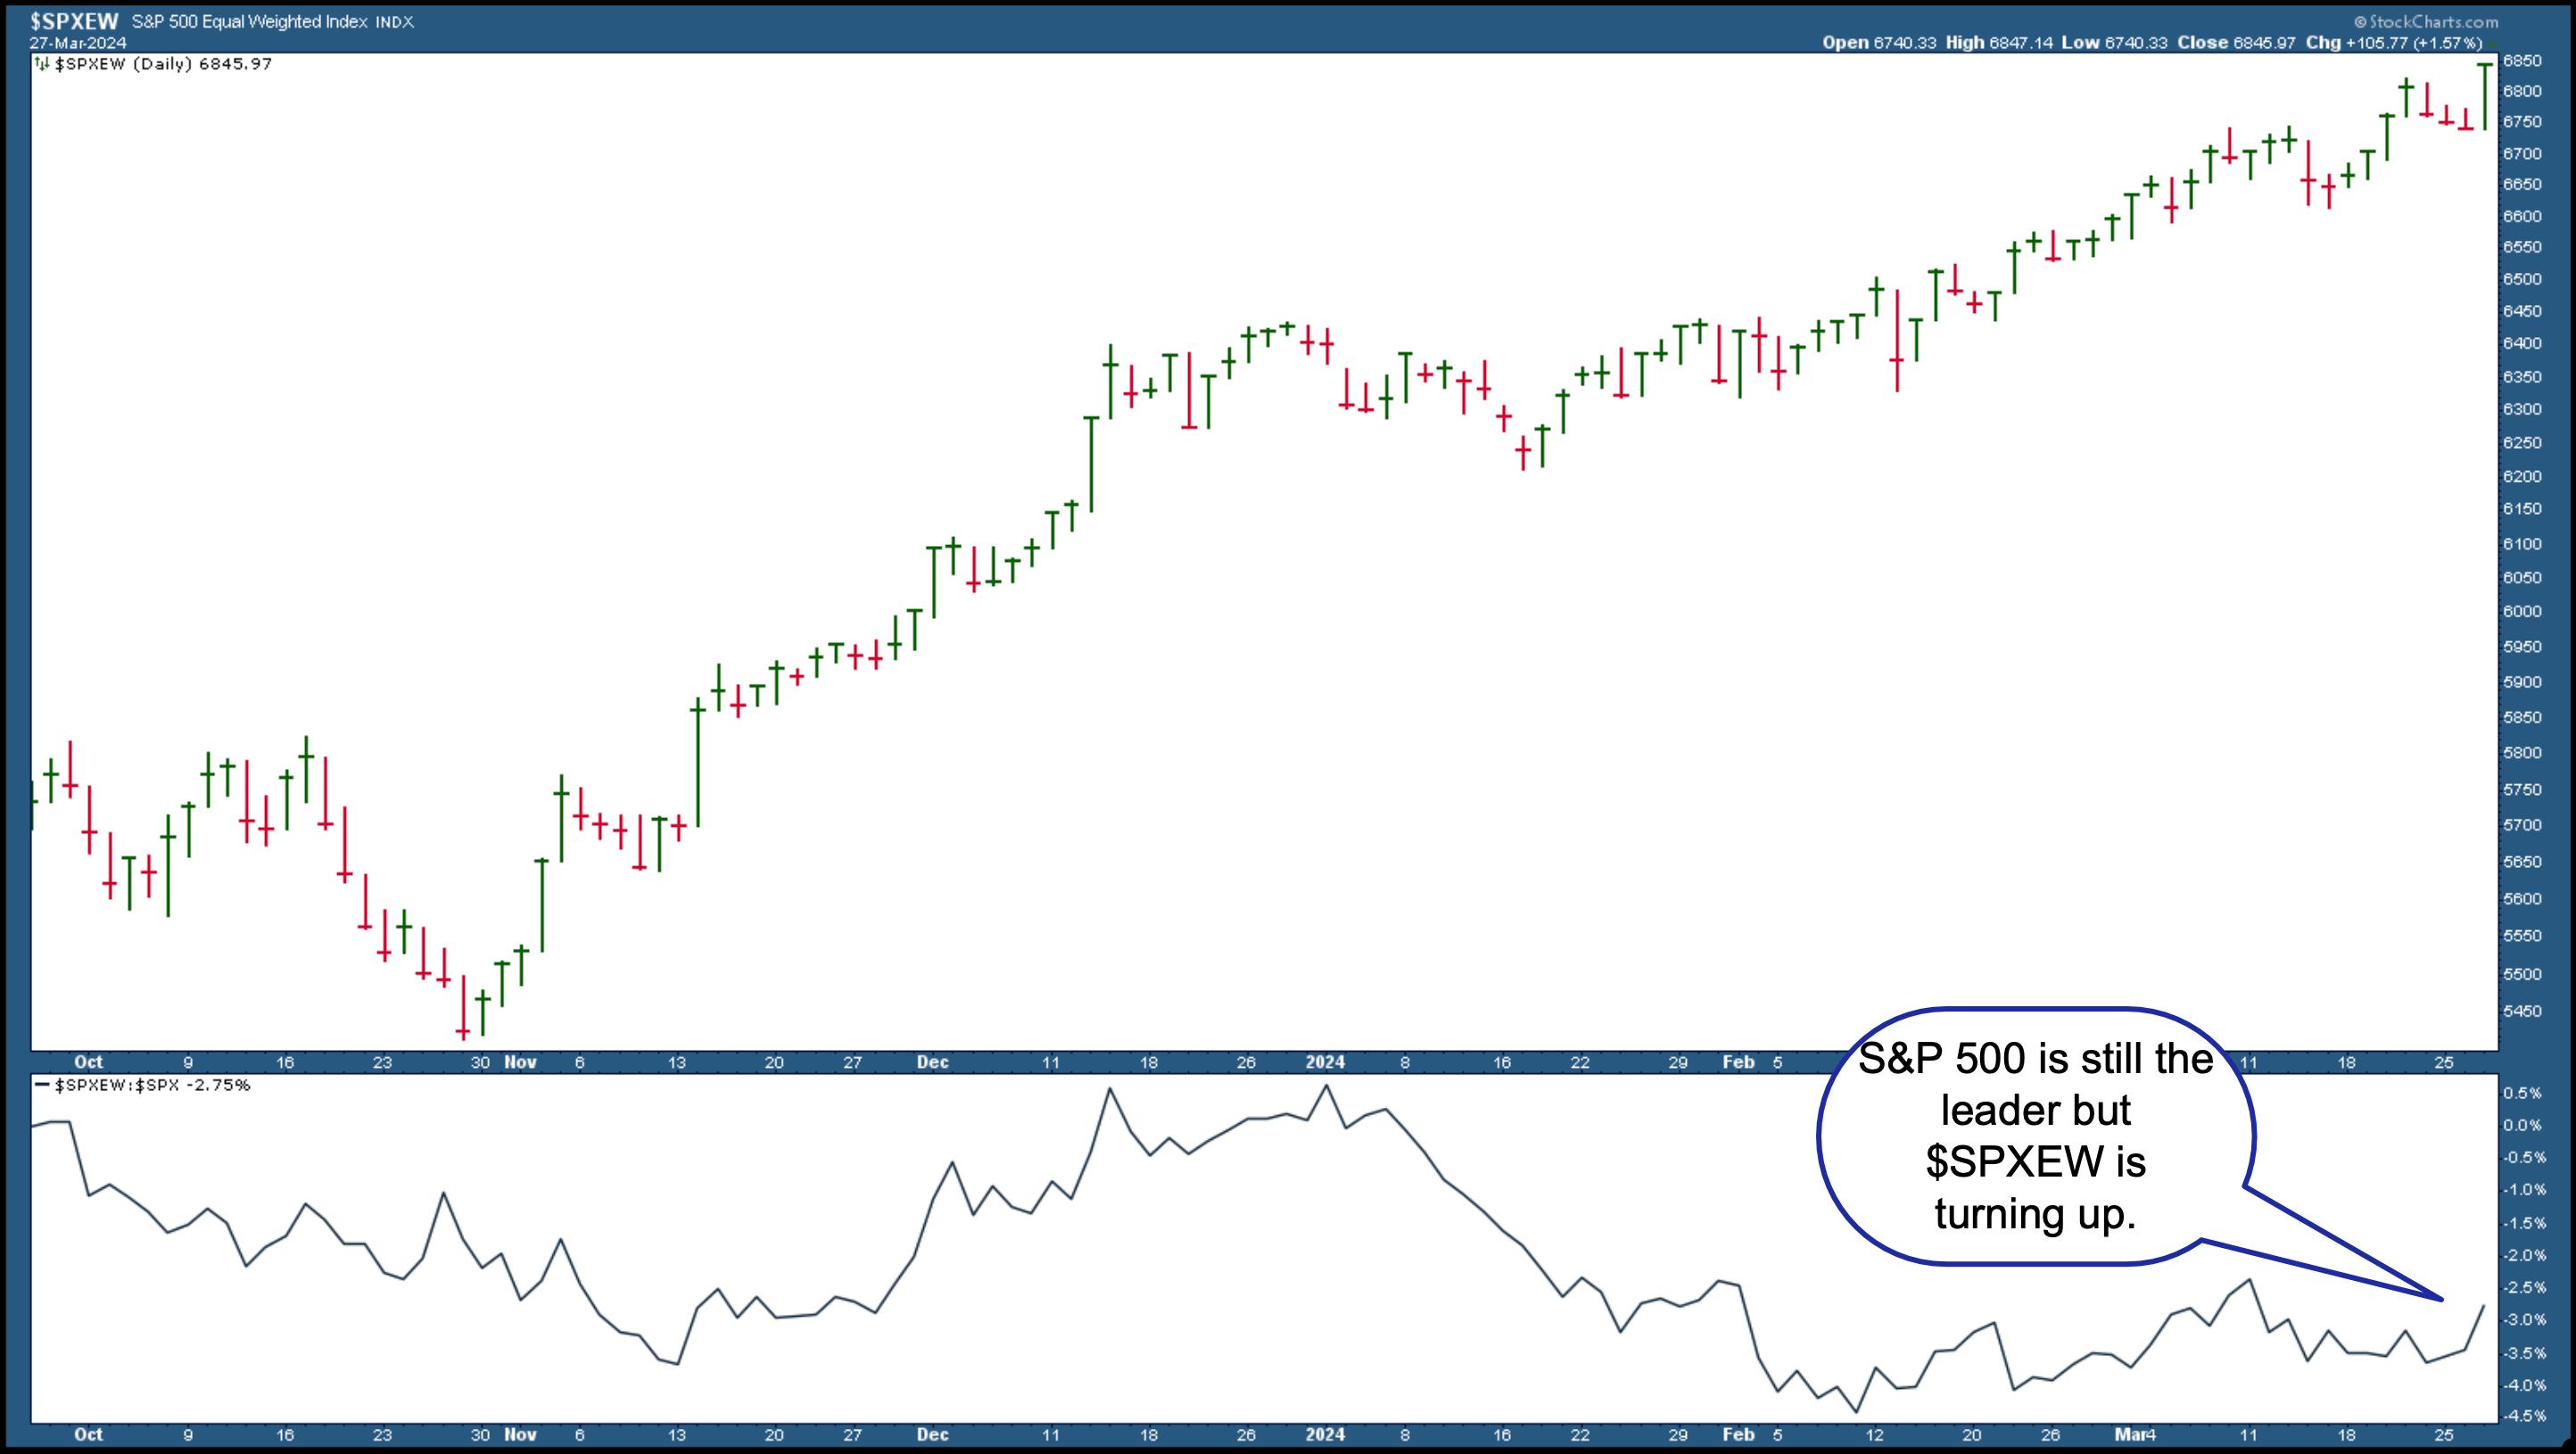
CHART 2. THE S&P 500 EQUAL WEIGHTED INDEX CLOSES HIGHER.
Keep an eye on this chart to see if $SPXEW continues to trend up. When comparing the performance of $SPXEW to the S&P 500 ($SPXEW:$SPX), which is displayed in the bottom panel, it’s clear $SPXEW is still underperforming the S&P 500 by a wide margin, but $SPXEW is starting to turn higher. If it continues in that direction, there could be increasing market participation from investors.
Small- and mid-caps also saw strong breadth. The S&P 600 Small Cap Index ($SML) closed higher and shows strong market breadth (see chart below).
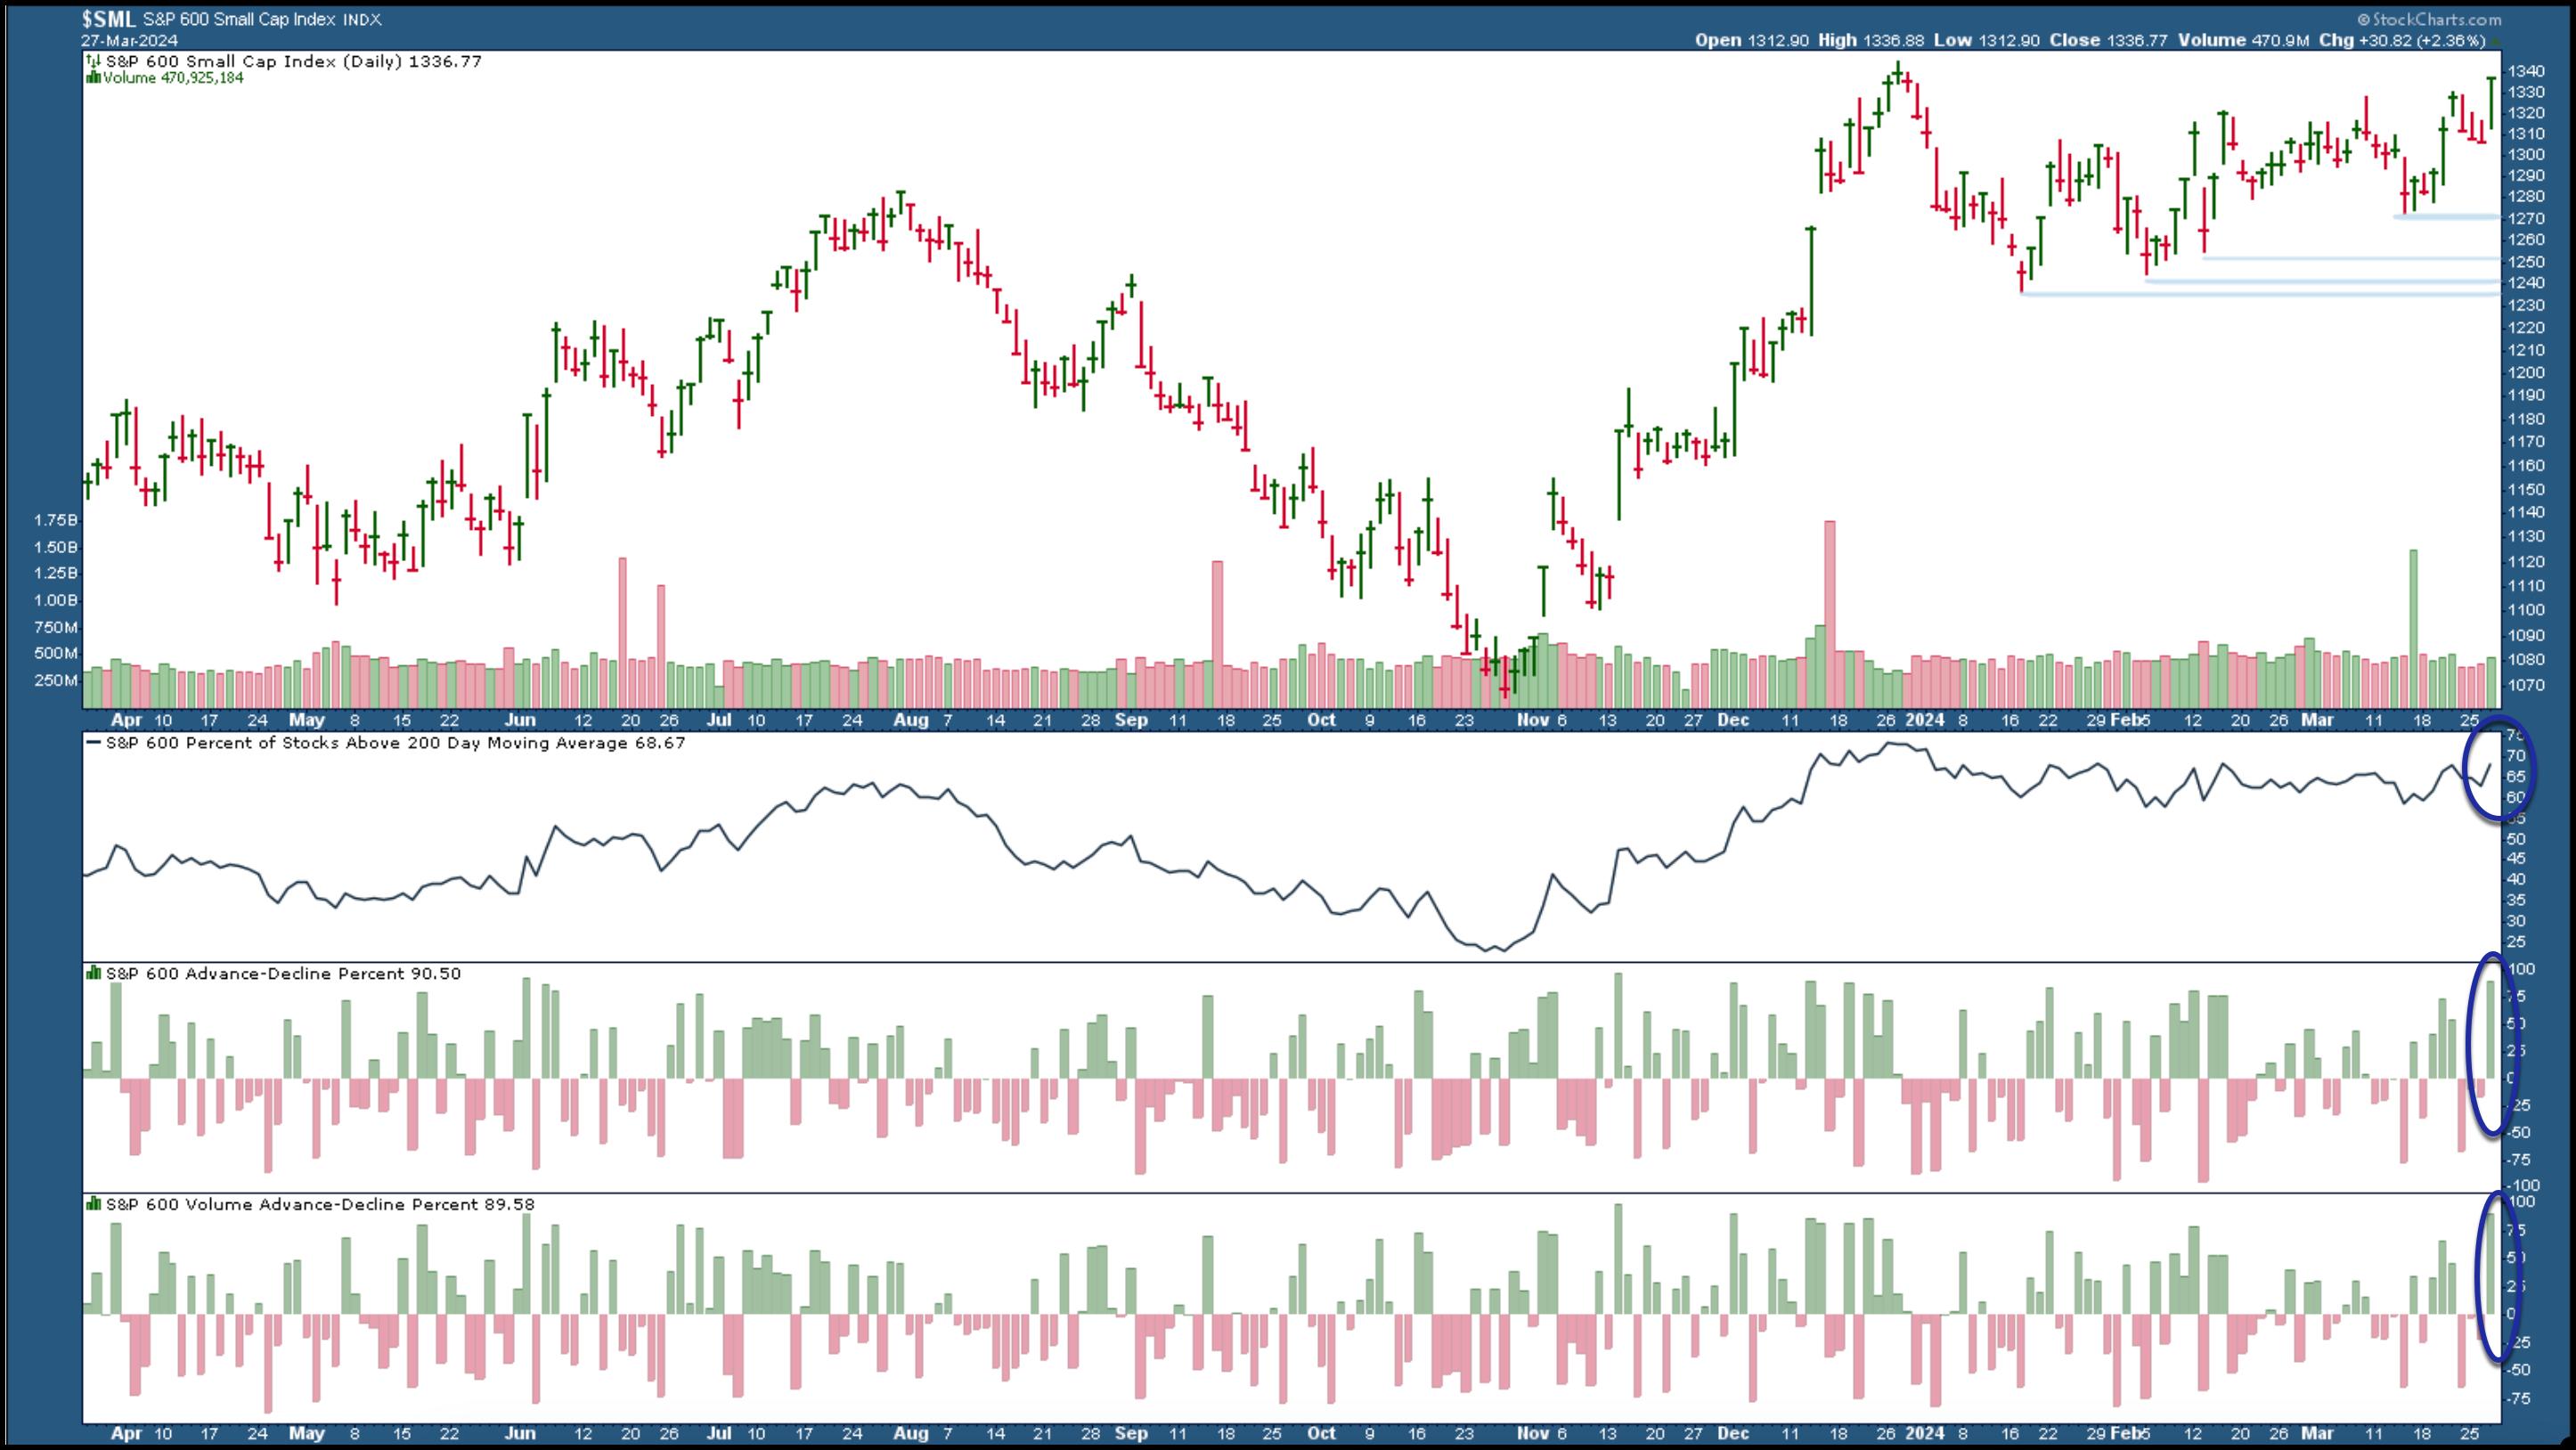
CHART 3. S&P 600 SMALL CAP INDEX CLOSES HIGHER. A breakout above the December 2023 high could be an indication of further strength in small-cap stocks. Market breadth in small caps is also strong.Chart source: StockCharts.com. For educational purposes.
The percentage of S&P 600 stocks trading above their 200-day moving average is almost 70%, with advancers far greater than declines. If you brought up a chart of the S&P 400 Mid Cap Index ($MID), you’ll see it hit an all-time high with market breadth similar to that of $SML.
Gold Soars
Another area not to ignore is gold. Gold prices have been on a tear. The monthly chart of gold futures ($GOLD) below shows that gold’s price has broken above its trading range and is now above $2212 per ounce.
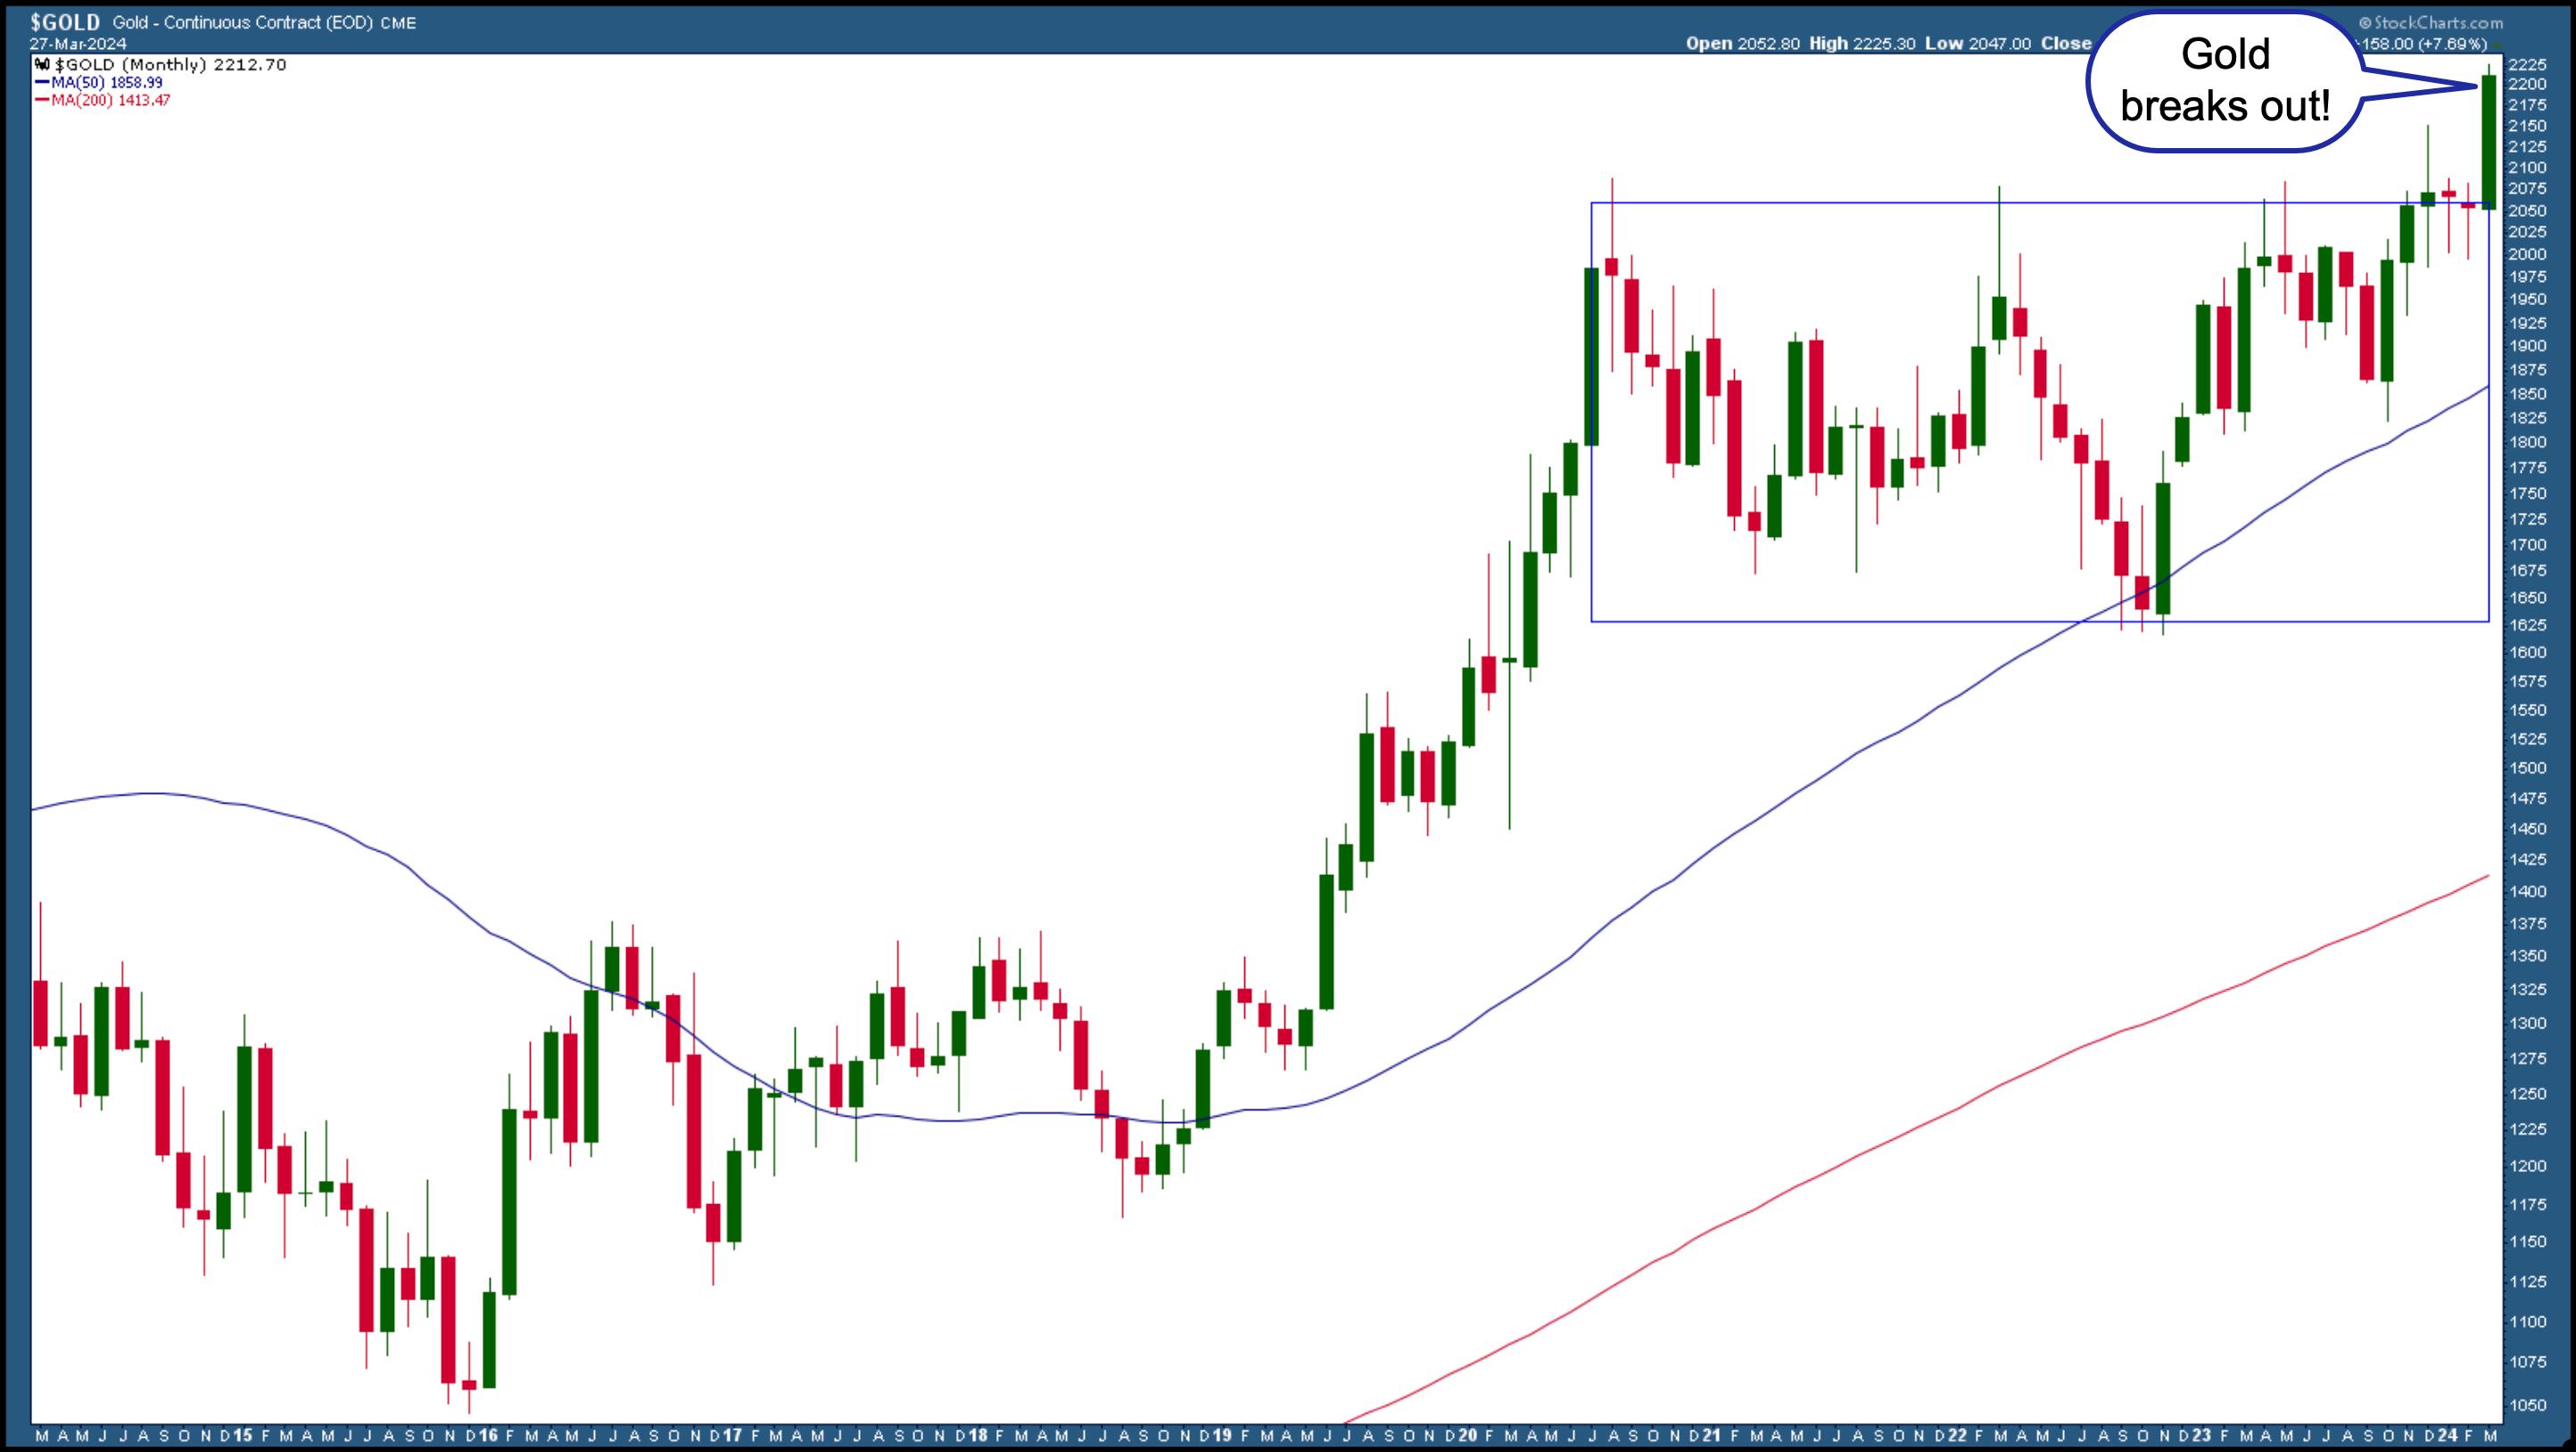
CHART 4. GOLD PRICES SURGE. This could be a short-term rally, but gold prices could rise much higher if there is momentum. Chart source: StockCharts.com. For educational purposes.
Gold continues to hit new highs, which is interesting because investors usually turn to gold as a hedge. But why hedge when inflation is cooling? It’s hard to say. Perhaps gold traders felt left behind and thought it was time to get in the spotlight. So, it may be a short-term rally, but if the momentum remains, you could take advantage of the rally by investing in an ETF like GLD.
Meme Stock Craze
Gold traders aren’t the only ones who are feeling left out. Some elements of meme stock mania show its presence in the stock market. Two stocks that have gained significant investor attention after a few days of trading are Reddit (RDDT) and Truth Social (DJT).
Is this a sign that investors are comfortable with where the stock market is now and are looking to make quick gains? It’s possible that we could see more investor participation as investors become more complacent. But this type of manic action can also signify a market reaching its peak. This doesn’t mean there’ll be a stock market crash. It does mean, though, that when there’s a shift in investor sentiment, it’s time to have your antennas up.
The Bottom Line
While a broad market rally is encouraging, it doesn’t mean you should get complacent. Trade with a risk management strategy and closely monitor the different sectors and asset classes. Seeing a big-picture view of the stock market enables you to navigate the stock market strategically so that you can see your investment returns grow.

Disclaimer: This blog is for educational purposes only and should not be construed as financial advice. The ideas and strategies should never be used without first assessing your personal and financial situation or consulting a financial professional.