


After weeks of uncertainty, the stock market finally gave us something to smile about. The major indexes just wrapped up four straight days of gains, and optimism is starting to creep back in. Could this be the shift we’ve been waiting for?
Let’s break it down.
The big concerns this week were all about tariffs and the potential removal of Fed Chairman Jerome Powell. But markets breathed a sigh of relief when it looked like tensions might ease between the two largest global economies. Plus, Powell staying put at the Fed helped calm some nerves.
In short, the fear factor took a breather, and the bulls took charge.
What Are the Charts Telling Us?
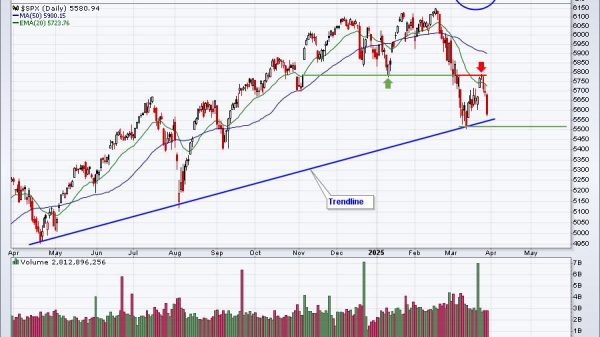
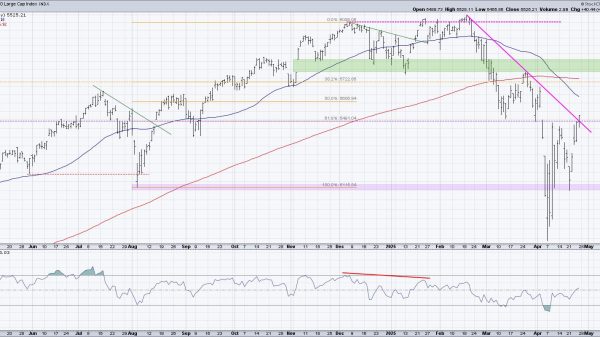
The S&P 500 ($SPX) crossed above the key 5500 level. This isn’t just any number; it’s a major line in the sand. It represents the March low and, if you go further back on the daily chart below, it has been a support and resistance level for previous price action. The purple horizontal line marks the 5,500 level.

FIGURE 1. SIGNS OF A TURNAROUND? The S&P 500 closed above the key 5,500 level, a major breakthrough. Breadth indicators are suggesting expanding bullish participation. Chart source: StockCharts.com. For educational purposes.
Even better, market breadth is improving.
- The Bullish Percent Index (BPI) for the S&P 500 is at 65% — a solidly bullish reading.
- The Advance-Decline Line is trending higher.
- The percentage of S&P 500 stocks trading above their 200-day moving average is beginning to display increasing bullish participation.
We are also seeing strength across the board:
- BPI readings for the Nasdaq 100, S&P 100, S&P 500, and Dow Industrials are all above 50%.
- 10 of the 11 S&P 500 sectors have BPIs above 50%, with Consumer Staples being the only one with a BPI below 50. This is surprising since it was one of the only sectors above 50% not long ago.
Sector Watch: Who’s Leading?
If you’re looking for clues about the market’s next big move, watch sector rotation. Right now, leadership is coming from:
- Technology
- Consumer Discretionary
- Communication Services
These are your classic “risk-on” sectors—if they’re leading, that’s typically a bullish sign.
What About Bonds, Gold, and the Dollar?
Some of the big-picture trends are starting to stabilize, too:
- Bond yields are dipping, which is helping bond prices recover.
- Gold pulled back after hitting new highs.
- The U.S. dollar is showing signs of strength again.
- And the $VIX—Wall Street’s fear gauge—is finally back below 30.
All small signs, but they add up.
Indicator of the Week: The Zweig Breadth Thrust
One indicator all technical analysts should take note of is the Zweig Breadth Thrust indicator. It’s a rare signal that flashes when market breadth shifts quickly from bearish to bullish.
The indicator is the 10-day exponential moving average (EMA) of net NYSE advances. The NYSE Breadth Thrust signal fires when the indicator moves from below 0.40 to above 0.615 in 10 days.
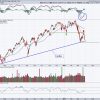
The weekly chart below shows that this is the third time the Zweig Breadth Thrust signal was fired in the last five years. The last two times this occurred were in 2023, when the NYSE recovered after dipping below its 40- and 150-week simple moving average (SMA). This time, the index bounced off its 150-week SMA.

FIGURE 2. ZWEIG BREADTH THRUST FIRES A REVERSAL SIGNAL. Previous signals have been followed by bullish moves in the NYSE. Will we see a similar scenario this time? Chart source: StockCharts.com. For educational purposes.The Zweig Breadth Thrust is a bullish reversal signal. Note that each time the signal was fired, the market moved higher. It doesn’t guarantee a bull run, but it’s a green flag.
What’s Coming Next Week?
If this weren’t a headline-driven market, I would be more confident about the possibility of the market moving higher. Next week is packed with potential market-moving headlines.
- Big Tech earnings
- Q1 GDP
- PCE Inflation data (the Fed’s favorite inflation gauge)
- ISM Manufacturing
- Non-Farm Payrolls
At the Close
The underlying market conditions are improving and some key signals are flashing green. But, as noted, it’s still a headline-driven market, and that means all the more reason to stay alert. Focus on leading sectors, watch for confirmation in breadth, and keep your investment plan tight.
End-of-Week Wrap-Up
- S&P 500 up 4.59% on the week, at 5525.21, Dow Jones Industrial Average up 2.48% on the week at 40,113.50; Nasdaq Composite up 6.73% on the week at 17,382.94.
- $VIX down 16.22% on the week, closing at 24.84.
- Best performing sector for the week: Technology
- Worst performing sector for the week: Consumer Staples
- Top 5 Large Cap SCTR stocks: Palantir Technologies, Inc. (PLTR); Rocket Lab USA, Inc. (RKLB); Robinhood Markets, Inc. (HOOD); Rubrik, Inc. (RBRK); MicroStrategy, Inc. (MSTR)
On the Radar Next Week
- Earnings season continues with Meta (META), Microsoft (MSFT), Apple (AAPL), Amazon (AMZN), and others reporting
- March JOLTs Job Openings
- Q1 GDP Growth Rate
- March PCE
- April ISM Manufacturing
- April Non-Farm Payrolls

Disclaimer: This blog is for educational purposes only and should not be construed as financial advice. The ideas and strategies should never be used without first assessing your personal and financial situation, or without consulting a financial professional.