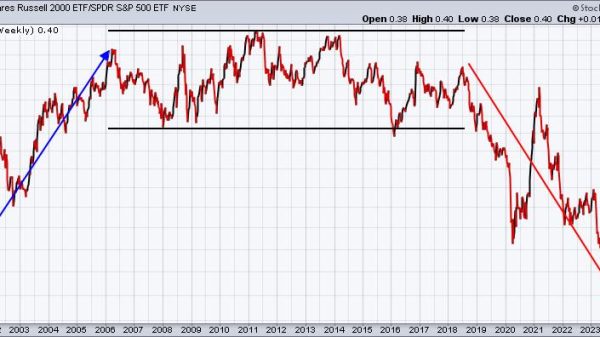
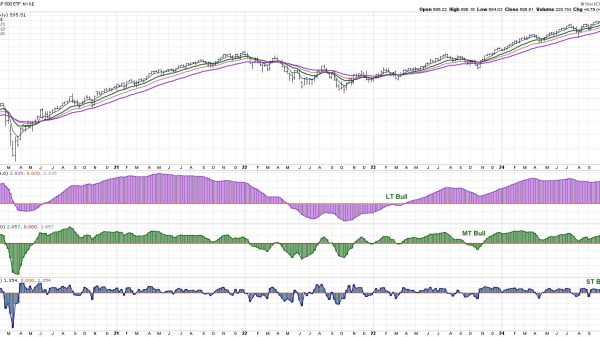
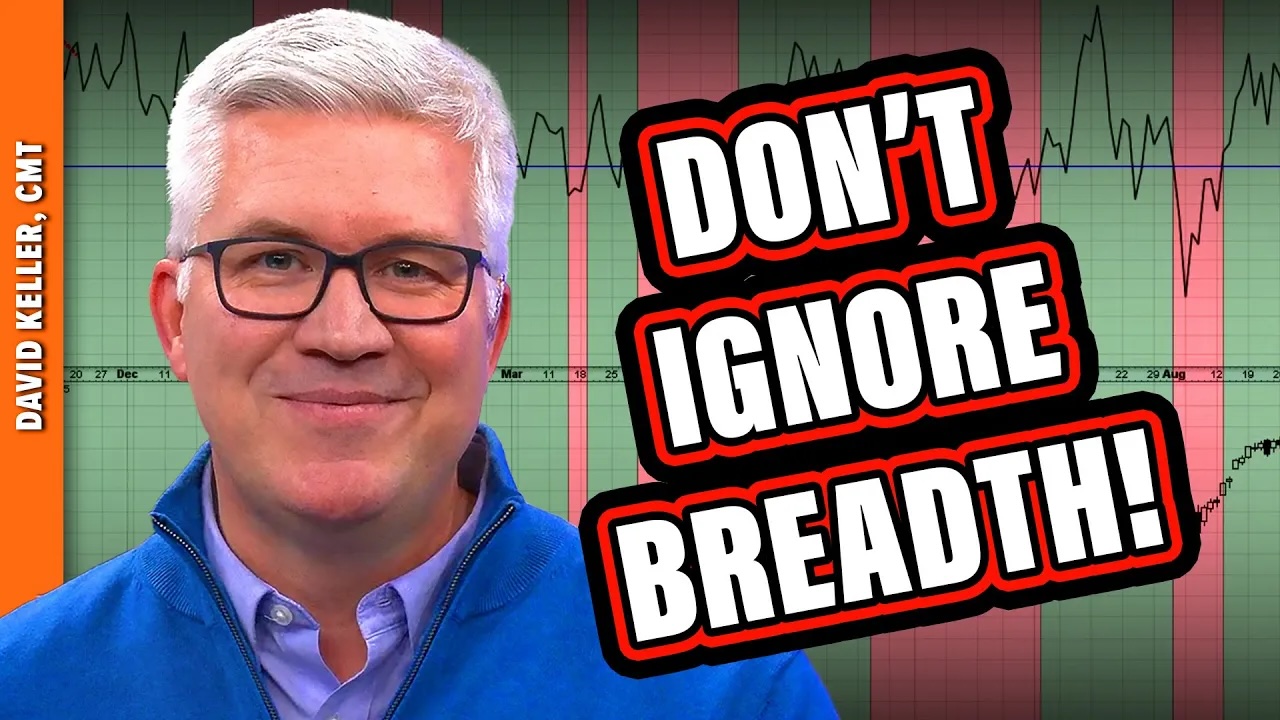
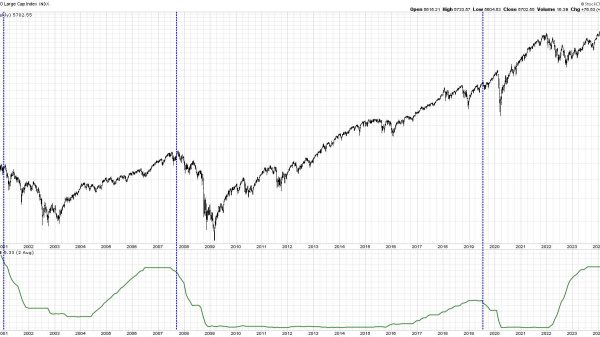
 In this video, Dave digs into five market breadth indicators every investor should track as we navigate a volatile period including Q3 earnings, the US elections, and the November Fed meeting. He breaks down key insights on each of the five charts, talks about why breadth indicators are equal-weighted, and relates all of this back to the most important chart of all: the daily S&P 500 chart.
This video originally premiered on October 28, 2024. Watch on our dedicated David Keller page on StockCharts TV!
Previously recorded videos from Dave are available at this link.
In this article:

